When the EU figures for regional GDP are published each spring, the headline is usually that parts of Wales are poorer than some far-flung parts of eastern Europe. True, but somewhat selective. So I thought I'd present a fuller picture.
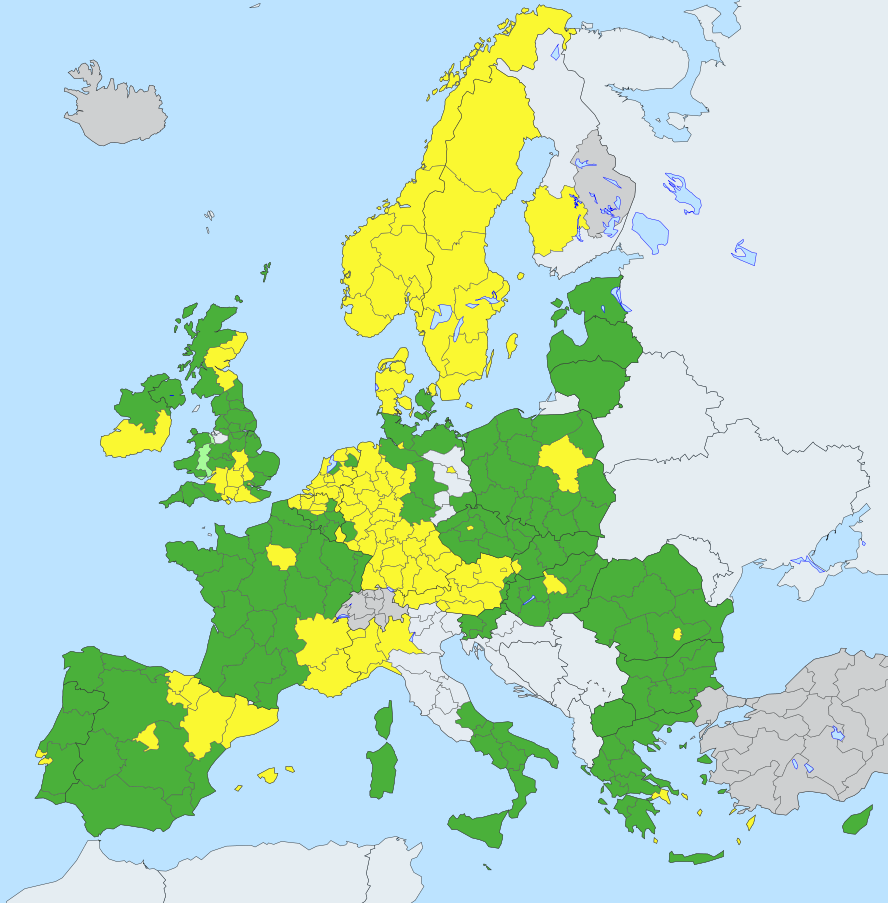
Wales is divided into two NUTS 2 regions: East Wales, and West Wales and the Valleys. In the first map, the regions that are poorer than West Wales and the Valleys are in green and the regions that are richer are in yellow, adjusted for relative purchasing power between member states, though not within them. The images and data are from here.
As we can see, it's bad. Apart from a handful of poor regions in Spain, Portugal and southern Italy, West Wales and the Valleys is the poorest region in the whole of Western Europe.
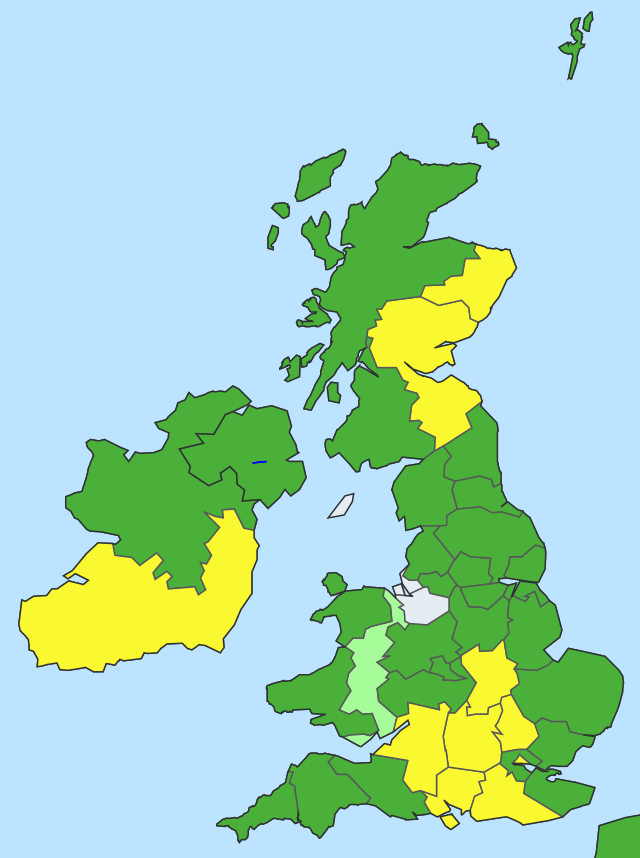
But the picture for East Wales is quite different. In the second map, the regions that are poorer than East Wales are in green and the regions that are richer are in yellow. East Wales sits comfortably in the middle.
Perhaps it's more informative to zoom in and look at the position of East Wales within the UK.
East Wales has a higher GDP per head than any part of northern England or the Midlands, with the sole exceptions of Cheshire (which is greyed out in the image, but should be yellow) and Leicestershire/Rutland/Northamptonshire. East Wales ranks above Manchester and Birmingham, and also above Kent, Essex and outer London. These are the figures:
GDP per capita in euros, PPS
Inner London ... 80,300
North Eastern Scotland ... 39,500
Berkshire, Buckinghamshire and Oxfordshire ... 34,900
Cheshire ... 28,800
Gloucestershire, Wiltshire and Bristol/Bath area ... 28,200
Surrey, East and West Sussex ... 27,900
Bedfordshire and Hertfordshire ... 27,500
Hampshire and Isle of Wight ... 26,700
Eastern Scotland ... 26,600
Leicestershire, Rutland and Northamptonshire ... 25,400
East Wales ... 24,600
East Anglia ... 24,500
South Western Scotland ... 24,300
Greater Manchester ... 23,500
Outer London ...23,400
West Midlands ... 23,300
West Yorkshire ... 23,300
Cumbria ... 23,000
Herefordshire, Worcestershire and Warwickshire ... 23,000
North Yorkshire ... 22,800
Derbyshire and Nottinghamshire ... 22,500
Dorset and Somerset ... 22,500
Kent ... 22,000
Essex ... 21,800
Northumberland and Tyne and Wear ... 21,500
Devon ... 21,400
Highlands and Islands ... 21,400
Northern Ireland ... 21,000
Lancashire ... 20,400
East Yorkshire and Northern Lincolnshire ... 19,900
Shropshire and Staffordshire ... 19,900
South Yorkshire ... 19,900
Merseyside ... 19,800
Lincolnshire ... 19,100
Tees Valley and Durham ... 18,900
Cornwall and Isles of Scilly ...17,600
West Wales and The Valleys ... 17,200
Statistics can be used to say almost anything, for Wales as a whole is still poorer than any other NUTS 1 region of the UK. The demarcation between East Wales and West Wales and the Valleys is contrived, to say the least. It doesn't follow any natural boundary, but was deliberately chosen so as to make West Wales and the Valleys as poor as possible relative to the rest of Wales in order to maximize the chances of obtaining EU structural and convergence funding. That stroke of genius has resulted in us getting billions of euros more than we would otherwise have got from the EU over the years ... I only wish the same genius had been around when it came to spending it.


1 comments:
Interesting post MH
THE EU figures confirm what the GVA results from the Welsh Government published every December have shown over the years that parts of Wales do well in a UK comparison, but overall they remain bad.
The challenge isn't just for the welsh media to stop sensationalizing their 'analysis' but to engage welsh politicians to recognize the importance of the figures and do something other than ignore them time and again.
Post a Comment